Rohinth Shanmugasundaram's Data Science Portfolio
Explore my skills, projects, and certifications in data science and analytics.
About
Welcome to my corner of the web! I'm a Business Intelligence Analyst bringing solid expertise in project management and data analytics. Skilled in using tools like SQL, Python, and Power BI, I formulate data-driven business strategies and have demonstrated success through capstone projects, improving market share by 15% and analysing 12+ data sets during my MBA program. I aim to showcase my work and capabilities, seeking a challenging role where I can expand my horizons across various functions.
Experience
Tiger Analytics - Data Science Intern
· Conducted Exploratory Data analysis on structured datasets using Python (Pandas, NumPy), Identifying patterns and visualizing trends using Matplotlib, Seaborn, and Plotly to derive actionable insights.
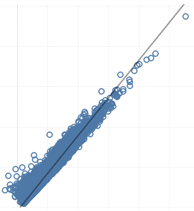
· Developed Linear Regression model (SKlearn, Statsmodel) filtering variables that have influence on the key variable of the dataset though R squared and P values.
· Designed and automated interactive dashboards with Power BI and Tableau, incorporating KPIs, Maps, Trend lines, slicers, and dynamic data transformation
Quantitative Methods: Statistical Modeling – Linear and logistical regression, Hypothesis testing, univariate and multivariate testing, clustering, decision trees, bootstrapping, neural networks, Prompting.
Statistical Tools: SAS Enterprise Miner, NumPy, Pandas, Scikit – learn.
Cloud Technology: Apache Spark, GCP.
Visualization Tools: Power BI (Power Query, DAX), Tableau, Pyplot, Seaborn Matplotlib.
Programming Languages: SQL, Python, R Programming
Data Manipulation Methods: VLOOKUP, HLOOKUP, XLOOKUP, Pivot Tables, Power Pivot.
Skills
Project Highlights
Explore my diverse data science projects and simulations here.
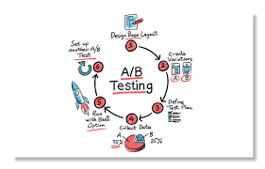
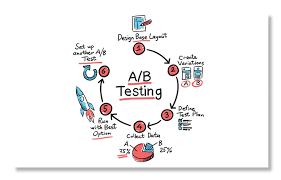


AB Testing (SQLite, Mode Analytics): Developed and analysed user engagement metrics, leading to key insights on customer behaviour.
Cyclist Data Analysis (R Program, Kaggle): Applied trend analysis to improve conversion of casual users into members for a bike-share program.
Distributed Computing(Apache Spark): Optimized Spark performance by 30% through partitioning, caching, and shuffle tuning while enabling time-travel queries.
Superstore Visualization (MS Power BI): Provided data-driven recommendations for expansion, targeting regional promotional strategies.


Exploratory Data Analysis (Python, Pandas, Seaborn): Identified top 3 states for expansion and best opening months (Dec/Aug/Mar/Nov) using sales/SGM trends, while highlighting high-risk store formats.

Linear Regression Model (Python, SKlearn): Found 'Total Store Sq. Ft', 'Centre Type Outlet', and 'Climate Hot' as top sales drivers, advising expansion focus while avoiding 'Centre Type Strip'
Coffee Orders (MS Excel): Analysed subscription patterns and provided strategies to boost brand popularity and standardize sales.
EDUCATION
Master of Business Administration (MBA) – Management Information Systems (MIS)
Employed SAS for Statistical Modelling, incorporating regression and multivariate analysis, bootstrap for random re-sampling, clustering for segmentation, decision tree for model comparison, and employing neural networks for machine learning tasks. Analyzed 12+ data sets as part of coursework.
Gained expertise in business excellence concepts, business objectives, economics, financial and accounting fundamentals, supply chain management, computer science, project management, IT, and technical business relevance. Applied these principles to 7+ real-world business case studies.
Wrapped up the course with excellence, proudly secured a noteworthy 3.56 GPA in entirety.
CAPSTONE BUSINESS STRATEGIC SIMULATIONS
Enhanced the market performance of a virtual company by conducting five rounds of strategic business process analysis across five product lines, leading to a 15% improvement in market share within a simulated environment.
Achieved this improvement by driving consumer preference analysis, product updates, and R&D investments, resulting in an 20% increase in product adoption and a 13% reduction in costs through automation enablement.
CERTIFICATION
Google Data Analytics Specialization - Google & Coursera
Distribution Computing with Spark SQL - University of California, Davis
Data Wrangling, Analysis and AB Testing with SQL - University of California, Davis
SQL For Data Science Specialization - University of California, Davis
Power Bi Workshop - Growth School
Power Bi A to Z, Hands on Power Bi Training for Data Science - SuperDataScience Team